TARAN PHILLIPS
Overview
Executive dashboards serve a different purpose than operational or analyst-focused reporting. Their job is to provide a concise, high-value view of organizational health, performance trends, and priority signals that support action.
The most effective dashboards reduce noise, standardize critical KPIs, and present insights in a format leadership can scan quickly and trust consistently.
Dashboard Design Principles
Focus on Strategic KPIs
Executives need a concise set of indicators that reflect business performance, not an overloaded reporting experience.
Highlight Trends Clearly
Dashboards should show whether performance is improving, declining, or holding steady across key measures.
Provide Business Context
Metrics become more useful when paired with targets, prior period comparisons, and clear definitions.
Dashboard Preview
A well-structured executive dashboard typically includes grouped KPI areas, concise trend visuals, and enough drill-through capability to support follow-up questions without overwhelming the first view.
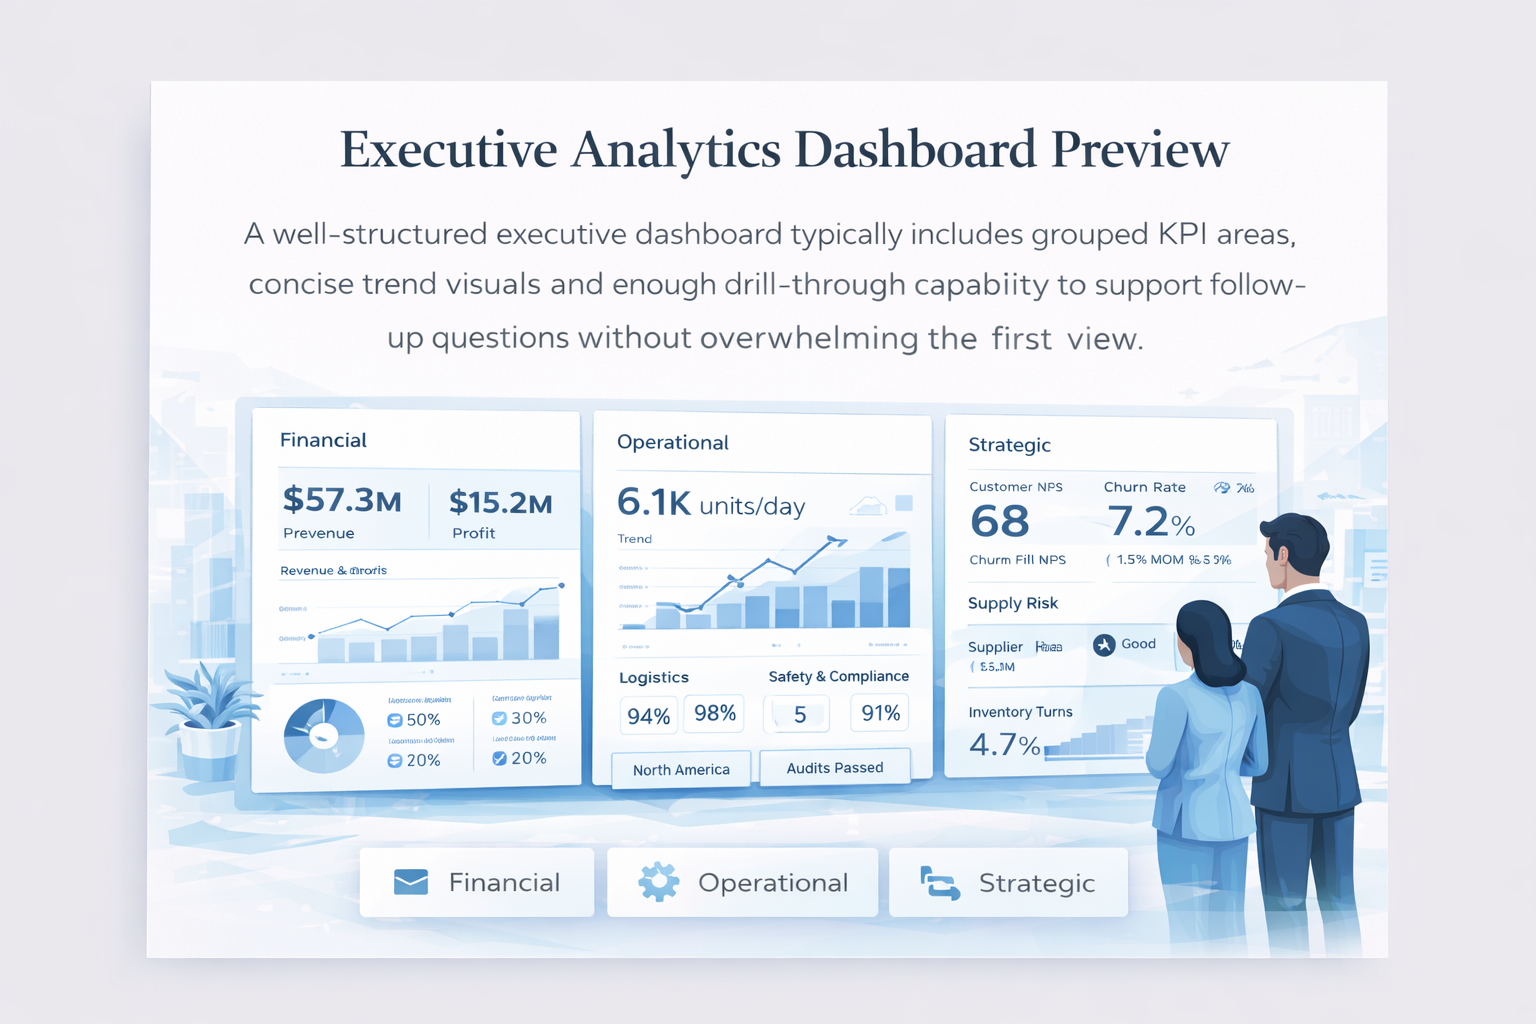
Primary KPI Groups
Financial Performance
- Revenue trends
- Budget vs actual views
- Expense and cost visibility
- Margin or profitability indicators
Operational Performance
- Service delivery performance
- Backlog and workflow status
- Efficiency and throughput metrics
- Productivity trends
Strategic Indicators
- Growth measures
- Customer or user engagement
- Program or initiative progress
- Leadership scorecard metrics
How Leaders Use This Dashboard
Executive Review Flow
- Review overall KPI status
- Identify performance changes or risks
- Compare current results to targets or prior periods
- Drill into areas requiring follow-up
Decision Support Value
- Surfaces high-priority trends quickly
- Supports better cross-functional conversations
- Improves trust in performance discussions
- Connects data review with leadership action
Role of the Analytics Leader
KPI Framework Design
Define the measures that matter most and ensure they are aligned with leadership goals and business priorities.
Governance & Consistency
Standardize metric definitions and reporting logic so leaders are working from trusted, consistent numbers.
Communication & Clarity
Present information in a way that reduces noise, highlights signal, and supports executive action.
What an Effective Executive Dashboard Enables
For Leadership
- Faster understanding of organizational performance
- Better visibility into risk and opportunity
- Stronger cross-functional alignment
- More confident decision-making
For the Organization
- Clearer KPI ownership
- Reduced reporting confusion
- More actionable performance discussions
- Improved use of analytics across teams